
Insights
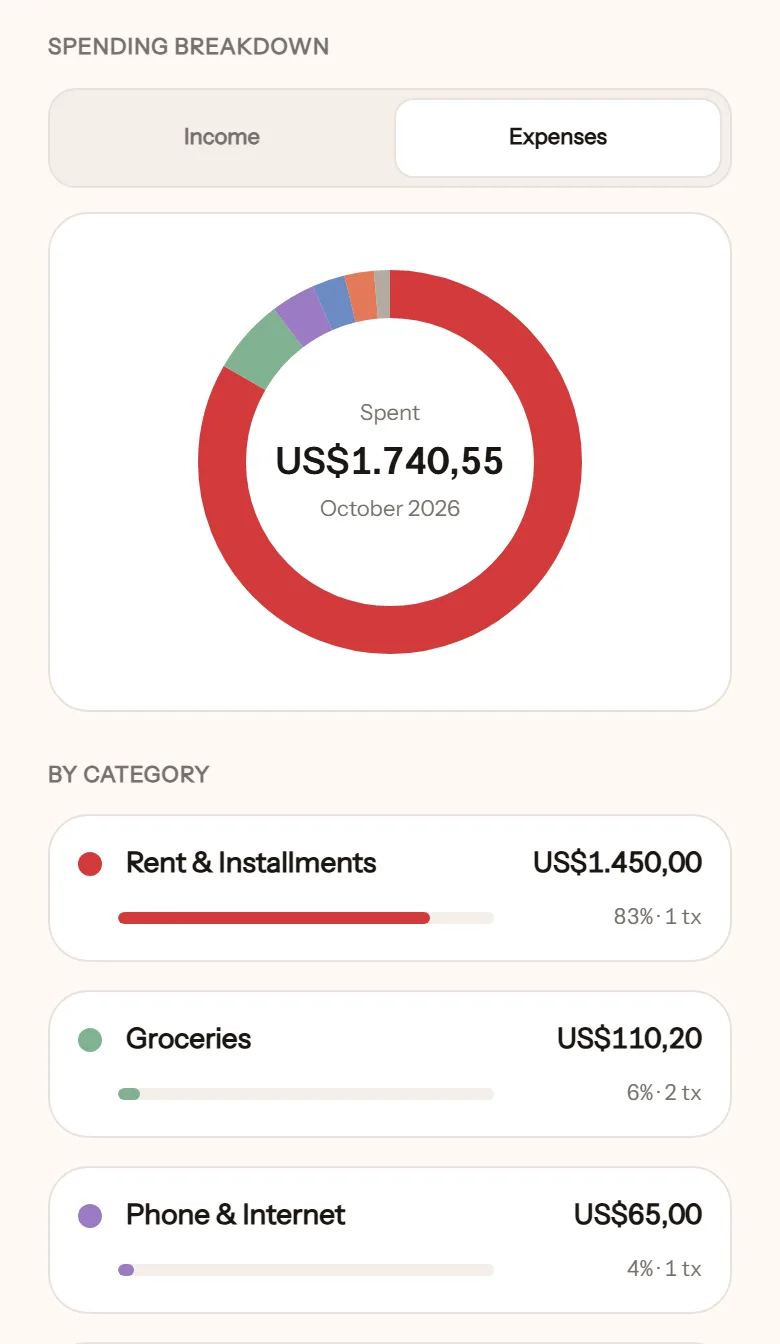
Insights, one tap from the home screen, answers the question that usually makes things tense: where did the money go? The answer is on screen, the same for both of you, so nobody has to ask.
What is there
Section titled “What is there”- Income, spending, net cash flow for the chosen period.
- Spending breakdown by category, with percentages and transaction counts. Tap a category to see its subcategories and the transactions inside.
- Income breakdown, if you want to see where money came in from.
- Trend by month, quarter, or year. For “is this category usually this big?”
Choosing what to see
Section titled “Choosing what to see”- All / Shared / Private: household money, your own money, or both together.
- Wallet filter: pick one or more wallets. If a wallet is normally excluded from totals, choosing it here includes it.
- Period: slide back to earlier months. Months follow your payday.
Transfers do not count as spending
Section titled “Transfers do not count as spending”Money that changed wallets appears separately as moved out of this wallet or moved in from another wallet. So an ATM withdrawal does not make your spending look doubled.
What your partner sees
Section titled “What your partner sees”Exactly the same, for everything shared. Your private insights are yours alone.